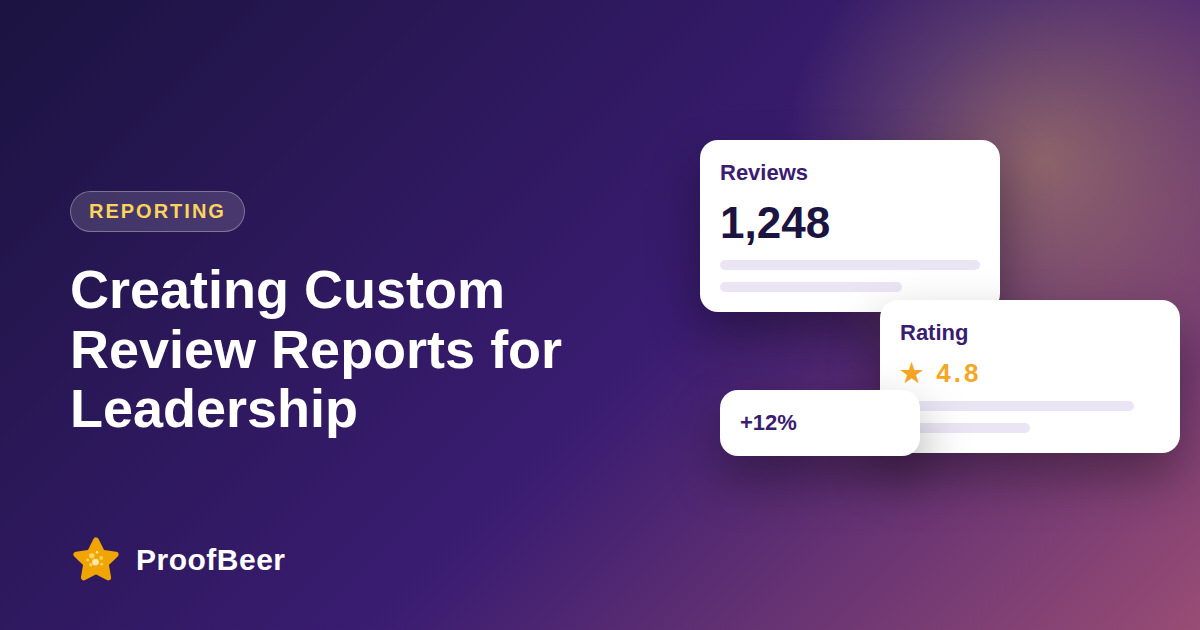
A leadership review report is a one-to-two page summary that shows your rating, review volume and response rate, explains what changed and why, and ends with a clear decision request. Lead with the answer, compare against the last period and a named competitor set, and link every theme to an owner and an action.
- Executives want to know what changed, why it matters and what decision you need, not a raw list of reviews.
- A four-part structure of snapshot, trends, improvements and goals fits on one or two pages and is easy to repeat each quarter.
- Every metric should be shown against the previous period so leaders can see direction at a glance.
- Competitor comparisons are more useful when they use the same platforms and the same date range as your own numbers.
- Revenue impact claims need written assumptions, otherwise leaders will rightly challenge the whole report.
- Each negative theme should come with an owner, an action and a due date so the report drives work instead of worry.
- Two or three charts are enough, and each chart should carry a one-sentence takeaway in its title.
- A consistent monthly data pull makes the quarterly report a ten-minute assembly job instead of a scramble.
What should a leadership review report contain?
- Open with the headline: your overall rating, its change from last period and the single most important story behind it.
- Show review volume, response rate and median response time, because leaders use these to judge operational health.
- List the top three positive and top three negative themes with a count of mentions for each.
- Add a short note on data quality, such as platforms covered and any gaps, so nobody mistakes missing data for good news.
- End the first page with a clear request, for example approval of budget for a fix or a new response target.
How do you show trends without overwhelming executives?
- Chart rating and review volume over six to twelve months on one simple line or column chart.
- Add event markers for product launches, price changes, outages or campaigns so spikes and dips have an explanation.
- Use a rolling average to smooth small monthly swings, and say how many months it covers.
- Point out seasonality when it exists, so a normal slow month is not read as a decline.
- Keep sample size in view, because a rating move based on a handful of reviews is a weak signal.
How do you connect reviews to business outcomes honestly?
- Use a three-step story of feedback, action and result, such as a repeated complaint, the fix your team shipped and the later change in related reviews.
- If you estimate revenue impact, show the inputs and the logic so readers can adjust the assumptions themselves.
- Label any estimate as illustrative and avoid presenting a correlation as proof that reviews caused a sales change.
- Pair review data with your own first-party numbers such as conversion rate, refund rate or support tickets where you have them.
- Where you cannot measure impact, say so plainly and propose how you will measure it next quarter.
How should you benchmark against competitors?
- Choose three to five direct competitors and compare the same platforms over the same date range.
- Compare rating, review volume and recency, since a high rating built on old reviews tells a different story.
- Look at the themes customers praise or criticise in competitors, not only the scores.
- Treat third-party benchmark numbers as context and cite the source and date next to each figure.
- Update the competitor set once a year so the comparison stays relevant to your real market.
How do you present the report and get decisions?
- Start the meeting with the answer and the decision you need, then use the pages as supporting evidence.
- Use plain language and avoid review-platform jargon that your audience may not know.
- Link to a live dashboard for anyone who wants more detail, and keep the report itself short.
- Assign every action an owner and a date, and record them in the notes so follow-up is easy.
- Open the next report by reviewing last quarter's actions, which builds trust that the report leads to results.
Step-by-step: how to do this with ProofBeer
Decide who the report is for and which three decisions they make that reviews can inform.
Pull rating, volume, response rate and response time from ProofBeer or your review sheet on the same day each month.
Add the previous period and one competitor comparison next to every headline number.
Tag the month's reviews by theme and pick the top three positive and negative themes.
Write the improvements-made section as feedback, action and result with an owner and date.
Draft the next-quarter goals, including a target rating, a response-time target and any resource request.
Have a colleague read the report cold and tell you the main message in one sentence, then edit until it matches.
Send it with a short note stating the decision you need, and log every action that follows.
Common mistakes to avoid
Metrics to track
Overall rating and change from the previous period.
Track review volume per month and growth rate every month so changes are easy to spot.
Track response rate and median response time every month so changes are easy to spot.
Track share of reviews tagged to each theme every month so changes are easy to spot.
Track number of review-driven actions completed on time every month so changes are easy to spot.
Quick checklist
Examples and templates
'Rating 4.5, up 0.1 from last quarter, driven by faster onboarding; response time now under 24 hours.'
'Feedback: setup was confusing. Action: video guide shipped in March. Result: setup mentions fell the next quarter.'
'Approve one part-time hire to meet a 24-hour response target.'
- Put the decision request in the first three lines
- Show assumptions beside any estimate
- Reuse the same template each quarter so changes are easy to spot
How ProofBeer Helps You Grow
ProofBeer collects reviews from several sources into one place so your monthly data pull takes minutes instead of hours.
Reviews can be synced to a Google Sheet , giving you a ready data source for dashboard charts.
Tagging and status fields help you group feedback by theme and show leaders which issues were acted on.
Frequently Asked Questions
How long should a review report for executives be?
One to two pages is ideal for most leadership teams. Put the snapshot and the decision request on the first page, and move detailed charts and raw data into a linked dashboard or appendix for anyone who wants to dig deeper.
How often should we send a leadership review report?
Quarterly works for most leadership audiences, with a lighter monthly update for the team that owns reviews. Pull the data monthly so the quarterly report is quick to assemble and trends are not missed between meetings.
Can we claim reviews drove revenue in the report?
Only with caution. Show the assumptions and label the figure as an estimate, and avoid saying reviews caused a change unless you have tested it. Pairing review trends with conversion data is more convincing than a single revenue number.
Which competitors should we compare against?
Pick three to five direct competitors that target the same customers, and compare the same platforms and date range. Include rating, volume and recency, and note that the comparison covers only public reviews.
What if our rating dropped this quarter?
Say so in the first line, explain the likely cause using review themes and event markers, and present the action plan with owners. Leaders respond better to a clear plan than to a report that hides a dip.
Where can we build the report?
Many teams use a spreadsheet or a dashboard tool such as Looker Studio connected to a review sheet. ProofBeer can export reviews to a spreadsheet , which gives you a simple data source for charts.
Conclusion
A good leadership report is short, comparative and honest about what is known and unknown. Build the four-part template once, refresh the data monthly and make every theme end in an owner and an
action.
- Looker Studio documentation
- HBR guidance on executive reporting